


The Philippine National IQ Question
Poor statistics and worse understanding

An interlude as we kindly await Ryan Mello to get back into writing CooRRECTor Piece 2—Economic Liberalization (and finishing the lone unfinished BAQ in Part 1 hidden behind the paywall).
While relatively old at this time, an editorial in the Philippine Daily Inquirer received recent buzz for bringing attention to the apparent problem of low Filipino IQ. Said editorial made a long list of what policymakers ought to do, yet said list only betrayed what was true for many talking heads: they don’t know what IQ is, nor how it is measured, nor what it measures.
Statistical illiteracy is strong among Filipinos, as past works on OCTA Research and CooRRECTors show. Reactions to recent performance among young Filipinos on certain international standards (PISA) only highlights how poor this understanding is. For starters, IQ is decidedly not a measure of critical thinking or gullibility to misinformation, nor does it decrease because of anti-intellectual shaming or peer pressure, and much less is it abstract reasoning, or even mere pattern recognition. Even worse, however, a misleading figure on the National average Filipino IQ keeps making rounds. We will shed light on what all these mean here while we wait for Ryan Mello to get started with his piece on Economic Liberalization.
What we Know about Cognition
The g-factor and IQ
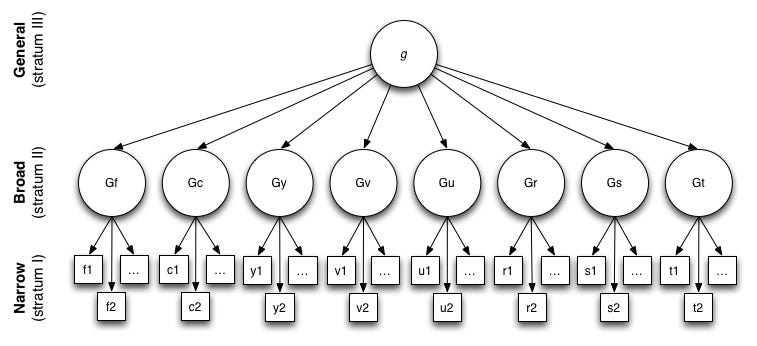
In 1904, Charles Spearman (of Spearman correlation fame) realized that children’s scores in tests across subjects were correlated. He hypothesized that a single general ability—the g-factor—underlay these good performances. Psychometrics has since advanced. Whereas Spearman used correlations to calculate how much g-factor a task used, modern techniques use factor analysis—used for other constructs like the Big Five/OCEAN personality traits.
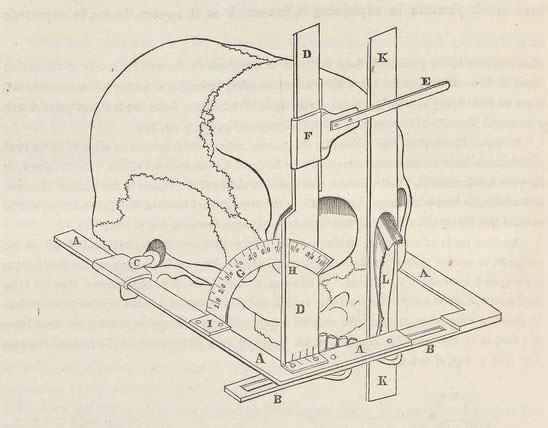
Actually measuring neurobiological determinants of cognitive ability is too time consuming. To wit, one would need to measure:
brain size;
reaction time;
brain nerve conduction velocity;
brain glucose metabolic rate;
features of brain evoked potentials;
among many other variables. Thus we construct the g-factor as an abstract, “latent”/hidden ability: we measure it through statistical treatments of intelligence tests. Certain tests (like the Stanford-Binnet 5) have high correlations with the g-factor, which we call high g-loading. Contrary to popular belief, Raven’s Progressive Matrices by itself has poor g-loading. A free test with high g-loading (of 0.91)—the 1941 US Army General Classification Test—is linked at the bottom of this essay for the reader’s use.
What we call “intelligence quotient” (IQ) is just one of many measures of intelligence, defined as:
the ability to learn, reason and solve problems. It is a latent trait that cannot be directly observed but is inferred from a battery of diverse cognitive test scores, as in widely used ‘intelligence tests’ that yield a so-called ‘IQ score’, which is an acronym for an outdated concept of an ‘intelligence quotient’.
Plomin, Robert, and Sophie Von Stumm. “The new genetics of intelligence.” Nature Reviews Genetics 19, no. 3 (2018): 148-159.
Tests for IQ and these other measures of intelligence all correlate with the g-factor, and hence IQ is often used synonymously with it. For convenience, the g-factor is quantitatively measured as IQ, which means we must discuss what IQ even is.
Suppose we make a sample take an IQ test. The average score of this sample is the standard for 100 IQ, and this sample with its result we call the norm. Thus, an IQ score of 110 means that one is ranked 1.1 times (110 = 1.1*100) above the norm, while an IQ score of 90 means one’s rank is 0.9 times (90 = 0.9*100) below the norm. This is all what IQ means.
While IQ as intelligence itself is an obsolete concept, IQ tests remain the best measure of g-factor that we have. Far from just pattern recognition, sophisticated IQ tests nowadays test for more variables, as the construction of g-factor above shows. These tests approximate a normal distribution, such that we can say that the g-factor is a normal distribution with mean 100, and a standard deviation of either 15 or 16.


The empirical normality of the g-factor is best seen in its implications.
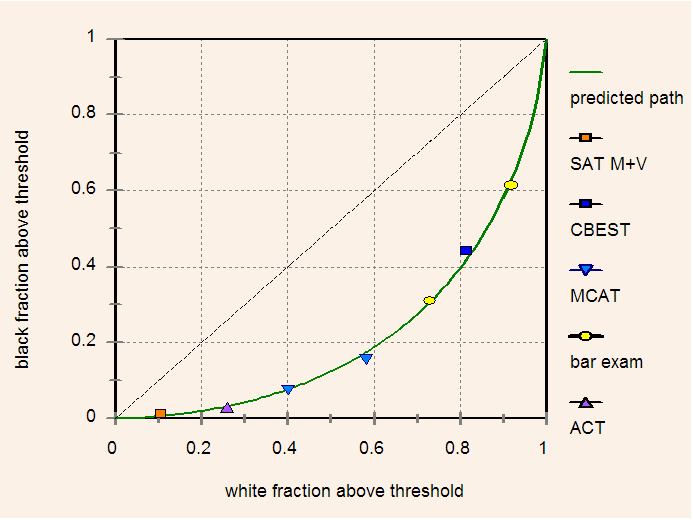
I now assert that a single Gaussian-distributed latent variable, plausibly g, uniquely determines the dense rank order of performance on large-scale standardized exams. There is a simple test of this proposition. If it is true, there will exist a single curve, derived from Gaussian distributions of g, upon which all observed points in diversity space, irrespective of their source, must lie. We merely have to find that curve.
Consider first the diversity space of blacks and Non-Hispanic whites. Seven points, chosen to span the range of proportions in diversity space, were obtained from five different large-scale standardized tests.
…
Although the observed points in diversity space were obtained from five different standardized tests they all lie close to the theoretical curve predicted by Gaussian distributions of g for both whites and blacks. [emphasis mine] Adjusted parameter values yielded a mean white-black difference of 1.09 SD equivalent to 16 IQ points in favor of whites and a variance ratio (B/W) of 0.888.
La Griffe du Lion, Intelligence, Gender, and Race: Conversation with a Progidy
Inheritability and Schooling’s Futility
The g-factor has been repeatedly shown to be 50% heritable on average. The other 50% consists of environmental influences outside one’s control during childhood. One’s final cognitive ability remains for life, with varying trajectories but on average decreasing with age. To wit,
Individual differences in intelligence are fairly stable across the lifespan, especially from teenage years onwards, with correlations of 0.6 and above. However, intelligence is also subject to change, both within and between individuals. For example, scores from timed cognitive tests tend to peak in young adulthood and decline thereafter. But more importantly, intelligence has been shown to be malleable, especially in children, through major systematic interventions, such as education, dietary supplementation or adopting children away from impoverished home environments. [emphasis mine]
Plomin, Robert, and Sophie Von Stumm. “The new genetics of intelligence.” Nature Reviews Genetics 19, no. 3 (2018): 148-159.
Schooling and education improve intelligence, but only to the extent of letting man use his potential. It neither widens nor lessens factors beyond his control—it provides only the handle to use his cognitive tools.
…an extra ten days of school instruction raises scores on crystallized intelligence tests (synonyms and technical comprehension tests) by approximately 1% of a standard deviation, whereas extra nonschool days have almost no effect. In contrast, test scores on fluid intelligence tests (spatial and logic tests) do not increase with additional days of schooling but do increase modestly with age.
Carlsson, Magnus, Gordon B. Dahl, Björn Öckert, and Dan-Olof Rooth. “The effect of schooling on cognitive skills.” Review of Economics and Statistics 97, no. 3 (2015): 533-547.
Even then, life experience more than makes up for deficits in schooling.

For the genetic half, the first confirmation came with using years of education as a proxy:
Its relevance to intelligence is that years of education is highly correlated phenotypically (0.50) and genetically (0.65) with intelligence.
…
Across studies, parents’ education correlates 0.30 with children’s intelligence, implying that it accounts for 9% of the variance in children’s intelligence. This association is, however, confounded by genetics, because children inherit the DNA differences that predict their intelligence from their parents. Furthermore, parental phenotypes, such as education, only estimate an average association for offspring, whereas GPS [genome-wide polygenic scores] predict intelligence for each individual.
ibid
Educational scores, while convenient, were not enough. Real g-factor scores went next:
Intelligence was assessed using various neurocognitive tests, primarily gauging fluid domains of cognitive functioning (Supplementary Information 1.1–1.2). Despite variation in form and content, cognitive test scores display a positive manifold of correlations, a robust empirical phenomenon that is observed in multiple populations. Statistically, the variance common across cognitive tasks can be modeled as a latent factor denoted as g (the general factor of intelligence). In addition, twin- and family studies show strong genetic correlations across diverse cognitive domains, suggesting pleiotropy, and across levels of ability, substantiating the view of general intelligence as an aetiological continuum (with rare syndromic forms of severe intellectual disability being the exception). Additionally, g-factors extracted from different sets of cognitive tests correlate very strongly (>.98), supporting the universality of g. In meta-analyzing cognitive scores obtained using a variety of tests, we aim to boost the statistical power to detect genetic variants underlying g, which are likely to have pleiotropic effects across multiple domains of cognitive functioning.
Savage, Jeanne E., Philip R. Jansen, Sven Stringer, Kyoko Watanabe, Julien Bryois, Christiaan A. De Leeuw, Mats Nagel et al. “Genome-wide association meta-analysis in 269,867 individuals identifies new genetic and functional links to intelligence.” Nature genetics 50, no. 7 (2018): 912-919.
These efforts and more all lead to more than 20% of the heritable half of cognition—10% overall—being pinned down with precision. Of course,
Until 2016, GPS [genome-wide polygenic scores] could only predict 1% of the variance in intelligence. Progress has been rapid since then, reaching our current ability to predict 10% of the variance in intelligence from DNA alone. GPS will soon be available that can predict more than 10% of the variance in intelligence, that is, more than 20% of the 50% heritability of intelligence estimated from twin studies, and more than 40% of the 25% SNP heritability of intelligence. This is an important milestone for the new genetics of intelligence because effect sizes of this magnitude are large enough to be “perceptible to the naked eye of a reasonably sensitive observer”. With these advances in the past few years, intelligence steps out of the shadows and takes the lead in genomic research.
Plomin, Robert, and Sophie Von Stumm. “The new genetics of intelligence.” Nature Reviews Genetics 19, no. 3 (2018): 148-159.

Gene-Culture Coevolution
Couples practice what we call assortative mating: men and women with similar genes get married and pass on their genes to their children. This phenomenon is well-documented, and readers can study the subject in their own time (take note any CooRRECTors reading this: even a little studying will boost your rotten brains back to life).
Beyond physical traits like height and weight among others, personality (Riemann and Kandler, 2020), intelligence (see above), among many other character and social traits are genetic. One would expect that this could apply to a country-wide context.
And it does: we have what we call gene-culture coevolution from repeated assortative mating coupled with the right social institutions. Suppose that in a counterfactual world (something Guido David will have great hardship understanding), a people’s leadership decrees that tall people will get paid more than short people. If men are the sole breadwinners, women will flock to the tall men. Tall men have more likelihood of passing their genes. Suppose even more that monogamy holds. Tall women will be prioritized by tall men out of assortative mating. Now introduce equality in the labor force. Short people are doomed to starvation, while the population becomes majority tall people.
In the real world, social institutions select for a wider range of traits depending on circumstance. Medieval Venice faced warfare from neighbors and eventually the Ottomans, so its societal institutions selected for intelligent people capable of violence to succeed. Constant warfare, however, would kill these successful people off:

Today, social institutions select for compliance, the desire to pass tests, subservience, among other personality traits desirable in bureaucrats and white-collar clerks. These institutions began with the Managerial Revolution, and the successful and elite selected by these institutions have corresponding traits and by extension genes:

Intelligence has always been valued as an elite trait. Only in the modern United States (and only in their cultural media no less) would you find the stereotypical distinction between geeks and jocks—the man of excellence who affirmed life honed both his physical and mental aptitudes.

Assortative mating coupled with social institutions in prosperous societies valuing intelligence and vitality ensured that the most successful always came from those with the most genetic potential—who also put in the work to make the most of their genetic potential. Institutions today will try to demonize one or the other, but the fundamental laws of reality will work to correct such actions. This Bioleninist trend—social institutions favoring genetic inferiors and dead-ends—inevitably will collapse as those of great potential who actualize them will get back on top.
One thus explains how differences in cognitive ability among population groups appear. Some cultures valued excellence in manual labor and drudgery, others in bureaucracy and compliance, still others on survival of the fittest. Those who rose to the top were the finest examples of their respective cultures, ensuring that their genes went on. Of course, a good few were disadvantaged in their cultures from passing their genes, especially as their surrounding institutions stagnated in changing times—leading to uprisings, turmoil, and regime change.
With all of this background in mind, we now tackle the Philippine case.
The Filipino National IQ
Somehow in early 2023, a host of Philippine outlets got their hands on the World Population Review’s citing of the Ulster Institute’s 2019 report on National IQs worldwide. After The Bell Curve [editor’s note: rather his works cited there], Dysgenics, and plenty other works, Richard Lynn and David Becker have been more well-known among Human Biodiversity (HBD) spheres than mainstream media. It should seem surreal that their work now stands to affect Philippine policymaking.
Then again, one can never expect Philippine regime mouthpieces to do more than the bare essentials in research and study: the World Population Review offers only convenience in collating data and figures, and not scrutiny in how they were collected. Lynn and Becker obviously cannot be faulted much for the way they collated and presented Philippine data, they are but messengers for a host of studies. That they were able to compile so many studies worldwide is very impressive. Their choice of studies in the Philippines proved unfortunate, however, and locals use their figures and estimates in slinging nonsense at each other.
The 1972 Flores Study
Lynn and Becker’s first cited study is the should-be infamous 1972 Flores and Evans study comparing some Filipino students from two private schools in Manila to some Canadian students from Canada. Two private schools in Metro Manila are obviously not representative of students in the entire country. Using this figure to stand for the whole Philippine population is so nonsensical. If one uses this statistic at all, he should use the Canadian estimate (87-90 IQ) at face value too!
One may counter (as Ryan did) that these two schools were private schools in the capital, hence the rest of the country is dumber since these students were among the top of the country. Ryan and hypothetical others don’t understand regression to the mean, anyone thinking along these lines other then Ryan himself must be selected against by social institutions in gene-culture coevolution. For all that we know, other private schools in Metro Manila have the same absolute value from 100 but positive instead of negative. This is not to mention that Lynn and Becker used only the study’s Raven’s Progressive Matrices portion (Table 3) to calculate IQ—real measures of g-factor use a whole battery of tests as was mentioned above.

Readers note: Lynn and Becker added a +1.47 Flynn effect correction when using this study as a source. In short, the Flynn effect is the sustained increase in cognitive ability over the latter 20th century. New norms—new estimates of average scores in IQ tests—are regularly calculated because of the Flynn effect. As we shall see, latter estimates of Filipino IQ are much higher (relative to updated norms) than those shown in the Flores and Evans study even when corrected for the Flynn effect.

The 2007 Visayan Blood Lead/Nutrition Study
The next study that Lynn and Becker cited was a 2007 study by Solon et al tackling the effect of blood lead concentration and nutrition among Visayan children. They administered the Wechsler Preschool and Primary Scales of Intelligence, third edition (WPPSI-III) to children aged 36 to 59 months. About 50 children—the youngest in the household as of the study—were randomly sampled from 30 health districts located in the Visayas. The authors also performed two-stage least squares to see what effects blood lead concentration had on IQ (with sex, age of child, roof materials (light), water source (rain), and a “breastfed for at least 4 months” dummy variable as instrumental variables for blood lead concentration-folate level interaction). We will print what adjustments Lynn and Becker did to the authors’ estimates:
They used the WPPSI-III and measured a V-IQ of 91.70 and a P-IQ of 97.50, averaged to 94.60. 0.68 IQ-scores must be deducted for FEcorrection and 2.50 for country-correction. The source reported a decrease in IQ due to an increase in lead concentration. Specific scores for children without or with only less lead exposedness were not reported but a decline of 2.47 IQ-scores in V-IQ, whereas no significant impact on P-IQ was found. To take this into account we added 1.24 (2.47 / 2), so the cor. IQ is 92.66.
Lynn, Richard, and David Becker. The intelligence of nations. Ulster Institute for Social Research, 2019.
Clarifying some terms:
“FE-correction” will always mean the [Test time adjustment] for Flynn-Effect-caused norm-inflations, “country-correction” will always mean the necessary adjustment if used norms were not standardized on a sample from GBR.
ibid
Note again from above: cognitive ability doesn’t become stable until late teens. These estimates are absolutely not representative of Filipino children in 2007, much less Filipino children in other years, much less all Filipinos. Not to mention that the study focused on bungsu/bunso/etc, such that regression to the mean would happen when looking at IQs of their siblings. For all that we know, their siblings have the same absolute value from 100 but positive instead of negative. If anything, these results show that any deficiencies in Filipino IQ come from non-genetic factors and are easily fixed over time—as these other studies show.

Before moving onto the last study, we will survey two important estimates left out of Lynn and Becker.
An IQ Study Uncited
In 2012, Alog would conduct her own study on older elementary students regarding learning styles and academic performance. The (in)validity of the “learning style” construct notwithstanding, she found that
Of the 313 respondents, 50.8% were males and 49.2% were females. There were 138 grade V pupils and 175 enrolled grade VI pupils for the school year 2009-2010. Over one-third of the respondents were in the middle average IQ while over one fourth were in the above average IQ. One in every five pupils in the elementary had bright to superior IQ, but almost one-fifth had low average IQ.
The reader should mind that the study’s abstract failed to explain what test Alog administered to the students. Eyeballing her results, however, gives a reasonable picture. Roughly half are below a norm, another rough half above—like a normal distribution with mean 100. Access to her study, however, will let us have a fuller picture of how she computed IQ scores.
The lack of public access is probably why Lynn and Becker failed to account for Alog’s study—the authors’ compilation of studies is impressive, and they cannot be faulted for cutting corners here and there especially for closed source studies. Central Philippine University (the study’s location) draws elementary students from Iloilo and its environs, so results here cannot be taken as representative unless aggregated with studies throughout the entire country.
In the United States
The United States has a long-running Adolescent Brain Cognitive Development (ABCD) Study. These efforts led to an impressive database with plenty of variables.

There is an obvious explanation for this figure. First off, we have self-selection. The best Filipinos all went to the United States, thus the figure there is higher. Regression to the mean happens to their descendants—but in a good way, with bad uncontrollable environmental factors gone, and their genes’ full potential now unlocked.
Of course, 20 IQ points’ difference is rather drastic. There are many successful and intelligent people in the Philippines, and the best of the best all could not have gone abroad. Local midwits will rant about this point, so let me ask: if all the smart people really did go abroad, why have you not gone abroad? How many exceptions like you exist who did not go abroad? Are all of you really that few that you can’t affect the average?
Another contention that I once shared is that Filipinos, being Austronesians, should share more in common with so-called “Pacific Islanders” than “Asians” in the United States. The truth will surprise you, dear reader.
Filipinos cluster more with “Asians” than “Pacific Islanders”
In 2000, The US federal government split the Asian American & Pacific Islander category into Asian and Native Hawaiian/Pacific Islander for that year’s Census. The latter had complained about cultural differences with Asians, and federal bureaucrats reached the same conclusions. Data collection since then has revealed the full depth of said differences.
For example, we have school disciplinary rates among ethnic groups.

Filipino children are on average well-behaved, the same as other “Asians”. As we saw above, rowdiness and other personality traits are mostly genetic. Bad personality traits would have been eliminated from the gene pool in war, executions, and ostracism. We can thus extrapolate that in many respects, Filipinos in the United States at least cluster with “Asians”.


We thus must go to the final study that Lynn and Becker cited in their report.
The 2006 Vista Study
In 2006, Alvin Vista would submit his Masters thesis in the state of Georgia. This was Transferability of norms: Norming the Naglieri Nonverbal Ability Test (NNAT) in the Philippine public schools. He administered the test to Grade 6 students across the country in 2006. He conducted three follow-up studies: gifted education, gender differences and effects of parental education (which we know from above is a proxy for parental g-factor). His studies remain the most comprehensive work on Filipino IQ to date.
One may question whether the NNAT has any validity as a measure of g. At the very least, it has more validity than Raven’s Progressive Matrices—or its colored version for that matter:

Using a more sophisticated regression design, the NNAT has yet even more validity!


The test remains valid despite cultural differences:
NNAT and CPM are nonverbal measures of general ability and therefore can be used for evaluating students in such a way as to reduce the role of language, knowledge, and academic skills on the measurement of ability (e.g., Naglieri & Ford, 2003; Naglieri & Prewett, 1990), making these tests appropriate across sociocultural backgrounds (Johnson, McGue, & Iacono, 2007). In our investigation, the step-down hierarchical multiple regression was significant for intercept bias for NNAT and CPM concurrent and predictive validities with math and reading comprehension tests. The practical effect of the intercept bias was negligible. However, as there were no differences in the achievement scores estimated by the same regression equation for all the FCS [Family Cultural Status] groups and by the three different equations with the three intercepts for each FCS group, both NNAT and CPM may be used to provide information about the future achievement scores regardless of the students’ FCS. Further investigations should examine whether CPM and NNAT also have measurement invariance and what the relationship between measurement invariance and invariance in prediction is (Millsap, 2007).
Balboni, Giulia, Jack A. Naglieri, and Roberto Cubelli. “Concurrent and predictive validity of the raven progressive matrices and the Naglieri Nonverbal Ability Test.” Journal of psychoeducational assessment 28, no. 3 (2010): 222-235.
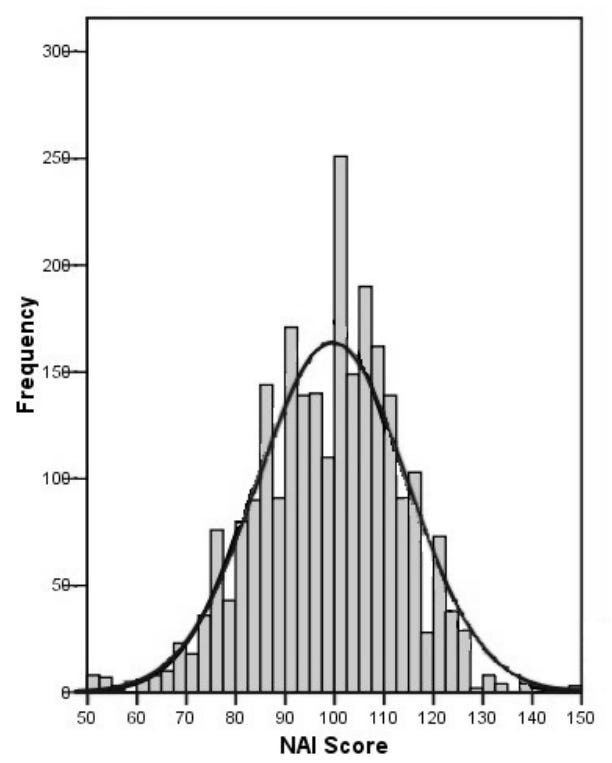
Thus we have a great measure of intelligence for Filipino students. Now, one may object that Vista’s studies were done on students, and measure unstable g-factor. Not to worry—Vista’s norms were US students of the same age and grade! It may not seem encouraging for some, till one realizes that Filipino students had the more or less the same average as US students.
The t-test indicates a statistically nonsignificant mean difference between the Filipino sample (M=18.7, SD =6.55) and US sample (M=18.6, SD=7), t(5016) = 0.522, p > 0.60. When 30 the mean NAI score for the Philippine sample (M=98.25, SD=14.31) is compared to the mean theoretical NAI score (M=100, SD=15), the t-test showed significant difference, t(5016) = 4.22, p < 0.01. However, as pointed out by Naglieri and Ronning (2000), simply reporting p-values is inadequate. A measure of effect size is needed to properly interpret the mean differences (Glass & Hopkins, 1996). Becker (1991) recommended that standardized mean differences, or d ratios, be used instead of mean differences. Aside from providing a more adequate indicator of the size of the difference, the d ratio is “the most widely used statistic in the metaanalysis of two-group studies” (Becker, 1991, p. 654). Table 4 summarizes the data comparing the Philippine sample to the US normative sample. Using both raw scores and scaled NAI scores in the analysis, both d ratios are less than 0.2, which is considered small based on Cohen’s (1988) suggestion of 0.20, 0.50, and 0.80 as small medium, and large respectively. Despite the results showing statistically significant mean difference in NAI scores of Filipino and US students, the difference between these means is relatively small (less than one-tenth of a standard deviation).
Vista, Alvin D., and G. Grantham. “Transferability of norms: Norming the Naglieri Nonverbal Ability Test (NNAT) in the Philippine public schools.” PhD diss., University of Georgia, 2006.
Any differences lay in stanines—the distribution of cognitive ability among nine percentiles.
A chi-square (χ 2 ) goodness-of-fit test was performed to determine if the observed proportions of scores from the Philippine sample differs significantly from the expected proportions based on the US norms. In conducting this analysis, the raw scores from the Philippine sample were converted into their stanine equivalents based on the US fall norms and the proportions for each stanine was compared with the expected proportions for those particular stanine based on the US normative sample… The result of the test was significant, χ 2 (8, N=2757) = 91.2, p < 0.01. The proportion of students in each stanine differs significantly from the expected proportion. These results suggest that the use of stanine conversion table based on US data will result in significant discrepancies for percentages of students classified in each stanine. A new stanine table was developed to reflect the proper proportions based on the scores from the Philippine sample.
ibid
The study is very long, and very interesting. It is a must read for anyone seriously committed to improving Filipino cognitive outcomes. Vista has results for differences among Luzon, Visayas, and Mindanao, and he tackles socioeconomic-demographic variables. His follow-up studies have even more interesting results which are a good read for everyone interested. We will spare the reader details for brevity.
Going back to the question of cognitive ability becoming stable, remember from the Norwegian study that fluid intelligence increases with age only. I would like to think that Filipino cognitive ability follows the same trajectory more or less as cognitive ability in the United States or Sweden, but only a follow up study would help determine this.
Now I would like to repeat what I said at this essay’s start:
IQ is decidedly not a measure of critical thinking or gullibility to misinformation, nor does it decrease because of anti-intellectual shaming or peer pressure, and much less is it abstract reasoning, or even mere pattern recognition.
It is up to social institutions to instill these.
Larger Implications
Social institutions remain the biggest barrier to Filipino cognitive ability reaching its full potential. For starters, Tagalog culture emphasizes subservience and docility. These traits will prove a barrier to a high IQ population—much less a high IQ population capable of abstract, analytical, and reflective thought. What more, Largoza and Garcia (2023) found that Tagalogs have high time preference—Tagalog culture values spending and acting in the moment over planning, deliberation, and looking before leaping. The authors of said study made a very stupid conclusion: it is Tagalog language that encourages high time preference because of the hard Saphir-Worf hypothesis and the presence of a future tense. Obviously they just found a good proxy for cultures in the Philippines, unfortunately they decided a-priori for no good reason at all that Philippine ethnic groups have homogenous (similar/the same) cultures.
But back to the main crux, the dominance of Tagalog culture in the country is the single largest barrier to proper use of cognitive ability. Any complaints about Filipino anti-intellectualism are in fact Tagalog anti-intellectualism. It bodes well that Tagalog culture has barely affected the rest of the country—only 19% have been integrated into the Filipino identity in 2007, and this number will become “only” 30% by 2050. Resistance to a dominant culture is in fact a marker for high cognitive ability, since these can achieve more in life without entering and participating in regime culture and institutions. New elite groups in fact form from naturally selected persecuted minorities who eventually overthrow the existing order.
Moving forwards, the GDP statistic that those who want economic liberalization ceaselessly peddle also turns out to be a function of cognitive ability, with 70% of variation in GDP coming from the g-factor.
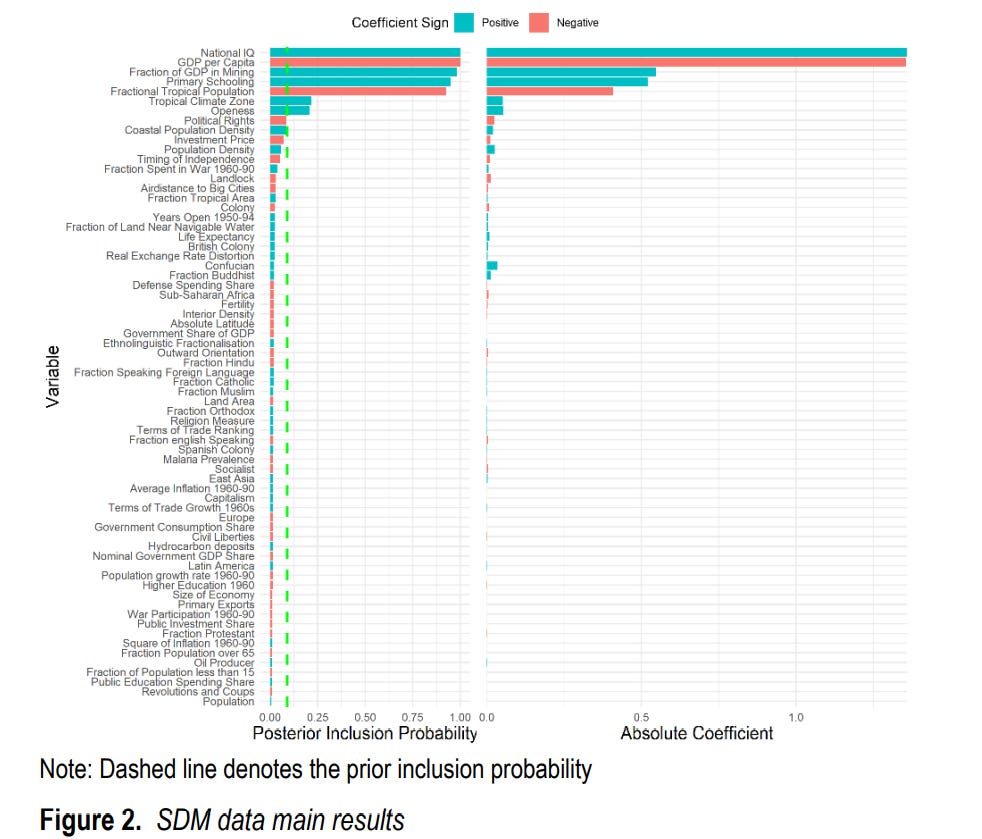
This result comes not from a simple linear regression, but from sophisticated Bayesian model selection. Instrumental variables also ensured a robust analysis:
We find national IQ to be the "best predictor" of economic growth, with a higher average coefficient and average posterior inclusion probability than all other tested variables (over 67) in every test run. Our best estimates find a one point increase in IQ is associated with a 7.8% increase in GDP per capita, above Jones and Schneider's estimate of 6.1%. We tested the causality of national IQs using three different instrumental variables: cranial capacity, ancestry-adjusted UV radiation, and 19 th-century numeracy scores. We found little evidence for reverse causation, with only ancestry-adjusted UV radiation passing the Wu-Hausman test (p < .05) when the logarithm of GDP per capita in 1960 was used as the only control variable.
Francis, George, and Emil OW Kirkegaard. “National Intelligence and Economic Growth: A Bayesian Update.” Mankind Quarterly 63, no. 1 (2022).
The fact that this result was published in Mankind Quarterly should not deter us from using it for policymaking. Mankind Quarterly, despite its poor reputation among undesirable people, remains a journal committed to rigorous research on controversial topics others refuse to touch. Aggregators like Scopus, Scimagojr, among many others agree.
Economic liberalization won’t fix existing institutional barriers to high IQ locals, much less the brain drain, and much less high IQ people choosing not to have children in favor of marginally more wagie pleasures. The government’s nutrition programs are one step in the right direction—but I fear that this will prove too little too late as social institutions remain inflexible, and societal upheaval happens when high IQ locals get disgruntled with lower IQ midwits receiving disproportionate access to resource and success.
Other Pillar of Liberty writers would agree.
Europe today also experiences a reverse Flynn effect. In other words, average European IQ has started decreasing over time:

Evidence from Norway suggests that this reversal comes purely from pure childhood environments. Nonetheless, Europe’s decline is a warning to policymakers in other countries. Those with great genetic potential with enough resentment towards existing institutions will find all possible ways to achieve said genetic potential.
This is not to mention the effect of IQ shredding.
In short, IQ shredding is when high IQ people choose clerical office jobs like accountancy or law and focus all their time and energy on said clerical office jobs instead of having children. High cognitive ability genes go to waste, and societal national IQ keeps decreasing over time. Spandrell explains its horrors in detail:
Mr Lee said: “[China] will make progress but if you look at the per capita they have got, the differences are so wide. We have the advantage of quality control of the people who come in so we have bright Indians, bright Chinese, bright Caucasians so the increase in population means an increase in talent.”
How many bright Indians and bright Chinese are there, Harry? Surely they are not infinite. And what will they do in Singapore? Well, engage in the finance and marketing rat-race and depress their fertility to 0.78, wasting valuable genes just so your property prices don’t go down. Singapore is an IQ shredder.
IQ Shredders
Filipinos definitely have the genetics. What matters more for the Philippines are institutions, nutrition, and catering to the gifted.
Try it yourself!
Take one of the following tests:
the Army General Classification Test. This test has been automated for the user’s convenience. More details regarding its validity today may be found here. In short, the Army General Classification Test is immune to the Flynn effect: its norms in 1941 are still valid today—people average in cognitive ability today perform just as well as average people did in 1941. This one, however, is heavy on computation—you will need a paper, a pen, and a distraction-free environment.
the Comprehensive Adult Intelligence Test. This test resembles the Weschler Adult Intelligence Test, but is free and open source. Using a diverse range of test batteries is the best way to estimate the g factor—the CAIT is designed to provide a more comprehensive view of general intelligence by testing multiple factors.
For comparison, Fellglow Keep has an IQ of 131 (98th percentile on 15 standard deviation; equivalent to 133 on 16 standard deviation).
Appendix: Just for fun!
I estimated my own regression using mean phenotypal/ “racial” ancestry proportions per ethnic group in the United States as the independent variable, and mean IQ as the independent variable. Listing all diagnostics:
genes and their proportions are ipso facto exogenous variables;
Jarque-Bera test statistic shows an extremely high p-value, so we fail to reject the null hypothesis that our residuals (and data) approximate a normal distribution;
Not a time series dataset, so serial time correlation does not exist—our Durbin-Watson statistic is 1.94 for that matter, very close to 2 (no serial correlation).
This regression was performed without an intercept term—meaning our model assumed that no other factors other than phenotypal ancestry determine IQ. This model gives a R-squared of 0.998—meaning that our “simple” model already determines 99.8% of all variance in IQ for the United States. Including an intercept lowers our R-squared to around 70% or so (worse), with a higher (worse) model F-statistic p-value.


One must note the following:
Ancestry percentages refer to ethnic group percentages—not individual ancestry.
The dependent variable is ethnic group average IQ—not individual IQ.
Each independent variable has maximum value 100 (in percentage). This is akin to using scaled/normalized data in other regression contexts.
Most likely:
European ancestry (“white”) refers to West Eurasian ancestry—hunter gatherers, Early European farmers, Yamnaya, among others.
“Asian” ancestry means East Eurasian ancestry—including Dravidian Indians, Negritos, Australian aborigines, and the like.
“Black” ancestry refers to sub-saharan African ancestry—those who remained in Africa while other human groups migrated.
“Native” ancestry refers to native Americans—those who crossed the Bering Strait.
The proper understanding of this regression is simply that an ethnic group with 100% “white” ancestry has 99.14 average IQ, “Asians” have ~108 average IQ, etc. This result resembles popular estimates of 100 white IQ and 107 Asian IQ—as a whole, “Asians” in the United States have on average 1.07 times more g-factor than whites. This fails to cover sensibility, common sense, phronesis, cognitive reflection, creativity, among other cognitive variables excluded by the g-factor construct.
The data came from an old version of the ABCD Database. No one should take these results too seriously—different versions of the dataset exist depending on compiler. My particular version, for example, was cited by Steve Sailer in May 2023 referring to a Human Varieties blogpost by “Chuck” who originally set non-Hispanic “white” IQ at 100. The compiler “Chuck” has since edited his compilation of the ABCD dataset. The version here has mean Filipino IQ at 104—you will see other figures listed below for Filipinos in the United States. A better study needs more rigorous scrutiny of data sources and of how independent variables were compiled and calculated.

Exercise for the reader
Simon Wright and George Francis have an essay:

They try to explain the low “white”-“black” g-factor gap in the United Kingdom. They fail when further information is brought up. The reader, if he chooses to do this exercise, must:
learn what self-selection is;
read on migration of skilled workers and other relevant demographics; and
use these to explain the low IQ gap between “whites” and “blacks” in the United Kingdom.
Further reading
Balboni, Giulia, Jack A. Naglieri, and Roberto Cubelli. “Concurrent and predictive validity of the raven progressive matrices and the Naglieri Nonverbal Ability Test.” Journal of psychoeducational assessment 28, no. 3 (2010): 222-235.
Bouchard, Thomas J. “The Wilson effect: the increase in heritability of IQ with age.” Twin Research and Human Genetics 16, no. 5 (2013): 923-930.
Carlsson, Magnus, Gordon B. Dahl, Björn Öckert, and Dan-Olof Rooth. “The effect of schooling on cognitive skills.” Review of Economics and Statistics 97, no. 3 (2015): 533-547.
Francis, George, and Emil OW Kirkegaard. “National Intelligence and Economic Growth: A Bayesian Update.” Mankind Quarterly 63, no. 1 (2022).
Fuerst, J. G., Meng Hu, and Gregory Connor. “Genetic ancestry and general cognitive ability in a sample of American youths.” Mankind Quarterly 62, no. 1 (2021): 186-216. [the state of the art analysis of the correlation of racial admixture and IQ, using a superb sample of 10,370 diverse Americans]
Gignac, Gilles E. “Raven’s is not a pure measure of general intelligence: Implications for g factor theory and the brief measurement of g.” Intelligence 52 (2015): 71-79.
Jensen, Arthur R. “The g factor: psychometrics and biology.” In The Nature of Intelligence: Novartis Foundation Symposium 233, vol. 233, pp. 37-57. Chichester, UK: John Wiley & Sons, Ltd, 2000.
Judd, Nicholas, Bruno Sauce, and Torkel Klingberg. “Schooling substantially improves intelligence, but neither lessens nor widens the impacts of socioeconomics and genetics.” npj Science of Learning 7, no. 1 (2022): 33.
Lasker, Jordan, Bryan J. Pesta, John GR Fuerst, and Emil OW Kirkegaard. “Global ancestry and cognitive ability.” Psych 1, no. 1 (2019): 431-459.
Lee, James J., Matt McGue, William G. Iacono, Andrew M. Michael, and Christopher F. Chabris. “The causal influence of brain size on human intelligence: Evidence from within-family phenotypic associations and GWAS modeling.” Intelligence 75 (2019): 48-58.
Matsumura, Hirofumi, Toyohisa Tanijiri, Makiko Kouchi, Tsunehiko Hanihara, Martin Friess, Vyacheslav Moiseyev, Chris Stringer, and Kengo Miyahara. “Global patterns of the cranial form of modern human populations described by analysis of a 3D surface homologous model.” Scientific Reports 12, no. 1 (2022): 13826.
Panizzon, Matthew S., Eero Vuoksimaa, Kelly M. Spoon, Kristen C. Jacobson, Michael J. Lyons, Carol E. Franz, Hong Xian, Terrie Vasilopoulos, and William S. Kremen. “Genetic and environmental influences on general cognitive ability: Is g a valid latent construct?.” Intelligence 43 (2014): 65-76.
Plomin, Robert, and Sophie Von Stumm. “The new genetics of intelligence.” Nature Reviews Genetics 19, no. 3 (2018): 148-159.
Sarraf, Matthew A., Michael A. Woodley of Menie, and Mateo Peñaherrera-Aguirre. “The anti-Wilson effect: The decrease in heritability of general cognitive ability, as proxied by polygenic expressivity, with advanced age.” Personality and Individual Differences 202 (2023): 111969.
Yamamoto, Kazuya. “Nation-building and integration policy in the Philippines.” Journal of Peace Research 44, no. 2 (2007): 195-213.
The Army General Aptitude test was fun! The box problems were mind-benders for me, while the division ones were very convenient - some of them had obvious multiples/remainders that cut out some choices. The normal word problems were giveaways for me since I read more than I should.
The finding that Filipinos are closer to Asians than Pacific Islanders makes sense to me. Filchi here, so I'm living evidence of Asian blending. Pacific Islanders also tends to refer to islands much farther from the rest of East and Southeast Asia, limiting cultural and genetic mixing over time.
I really don't belive that Filipinos are dumb in raw intelligence - rather, we're held back by being late to the modern party and a very contextual frame of mind. I haven't gone looking for proof, but our languages tend to require a lot of context, with the assumption that you already know each other's business and can infer from there. I've written on this here:
https://argomend.substack.com/i/128911972/dito-diyan-doon
This contrasted with English which is very much "the word is the word".
Edit: Tip for the box questions: Always count the hidden boxes implied by different heights and lengths. If a box isn't in line with another box, there's another box hiding in the back.